
Site-Search Performance
awoo AMP analytics on the performance of the awoo Search.
✨ Preface
If you're using our site search service, you can see the revenue generated from searches and product click data. Additionally, you can review the performance of each search term, including the click-through rate of products under each term. Sales data derived from the last-click attribution principle allows customers to understand the extent to which awoo search results match visitor interests and successfully generate purchases.
👀 Metrics Overview
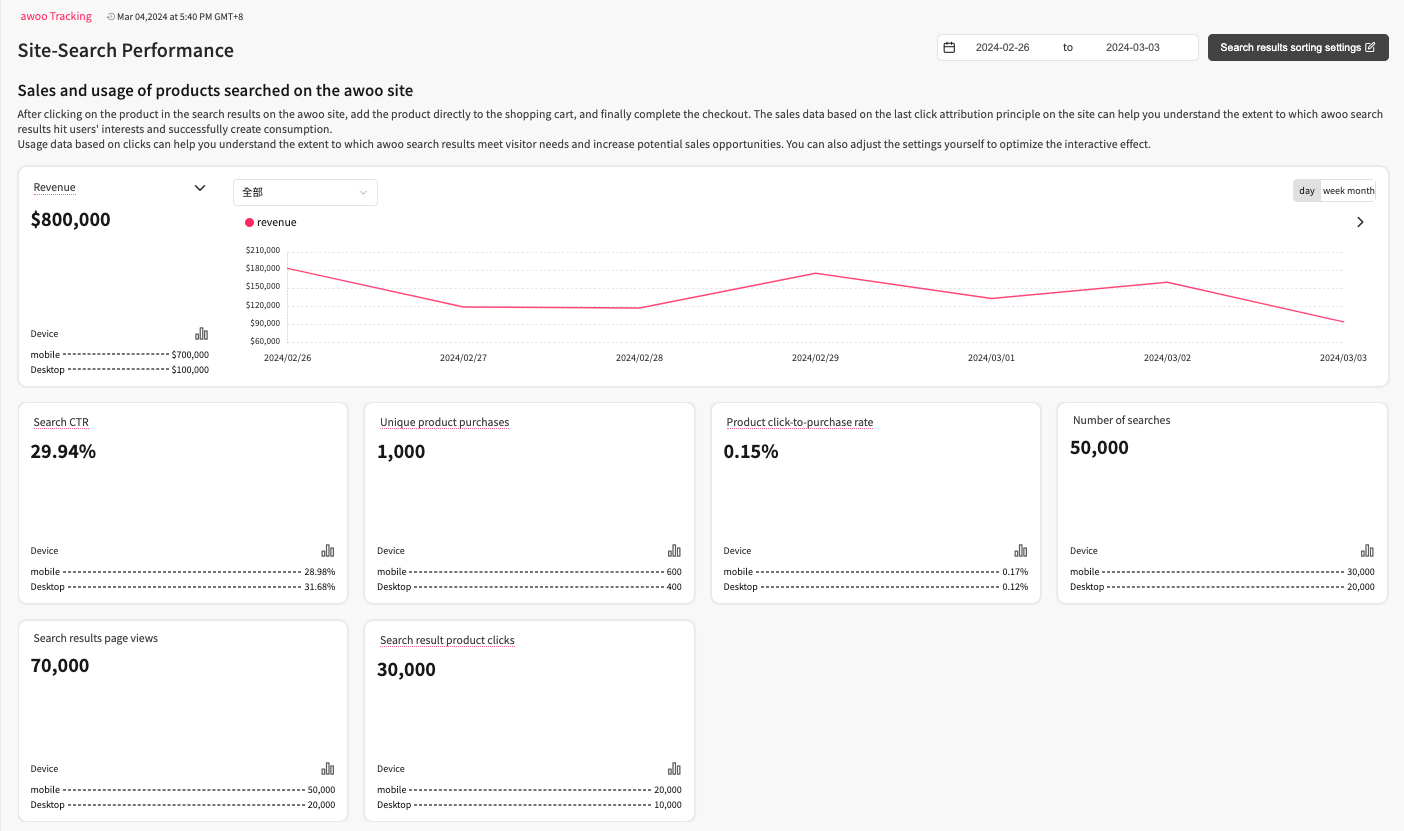
performance panel of the awoo Search
1️⃣ Product Revenue
The product revenue value is obtained by multiplying the sale price by the number of products that were added to the shopping cart and purchased right after clicking the same item on the search results page in a single session. The main card presents this data by default, positioned prominently at the top of the section, enabling users to observe data trends over time.
2️⃣ Unique Product Purchases
The number of times a product is added to the shopping cart and purchased right after clicking the same item on the search results page in a single session. If a transaction involves the purchase of 1 white shirt, 2 red shirts, and 3 pairs of socks, the order counts as 3 unique product purchases (3 unique PID purchases).
3️⃣ Product Click-to-Purchase Rate
The click-to-purchase rate is calculated as follows: (The number of times a product is added to the shopping cart and purchased right after clicking that same item on the search results page in a single session) ÷ (The number of times any awoo search result product is clicked within the past 24 hours).
This metric indicates the probability of product clicks from awoo site search leading to a successful product purchase. The reason for looking back "past 24 hours" for the denominator is to align with the "maximum single session length of 24 hours" for the numerator, maintaining the same time window.
4️⃣ Searches
The number of search submissions. It includes the number of times a search is automatically submitted by the system after clicking on AMP-suggested search content.
5️⃣ Search Result Page Views
The number of times the search results page is viewed. Please notice that entering the same URL from different source pages or simply refreshing with F5 is considered separate page views. Repeated views of the same search results pages will be cumulatively counted.
6️⃣ Search Result Product Clicks
The number of times any search result product is clicked on the search results page. Repeated clicks on the same product will be cumulatively counted.
7️⃣ Search Click Rate
The ratio of searches that are followed by any result product clicks on the search results page in the same session. This metric indicates the proportion of searches whose results successfully match the intent, leading to result clicks (product clicks). If more than one product click occurs after the same search, the numerator's click count will not accumulate; it counts as only 1 click at most, so the click-through rate is still 100%.
📐 View Metrics on the Line Chart
Yes, when you click the dropdown arrow next to the metric name of the top main card, you can change the card content to other metrics. Choose the metric you want to see in the dropdown, and the system will allow you to view the changes in that data over a specific period in the main card. You can also hover over a card without a line chart, and drag it to change the order of these small cards.
After changing the order, a prompt to save this setting will appear at the bottom of the screen. Click confirm, and the next time you return to this page, it will be arranged according to your settings.
📱 View Metrics across Different Devices
Yes, the data for both mobile and desktop devices is displayed by default under each card. By clicking the icon next to "device category," a modal will pop up showing the breakdown of data each device type accounts for. The Mobile section will display data for both iOS and Android separately. Moreover, in cards that primarily show line charts, you can select from a dropdown menu to view the data trends for different devices separately.
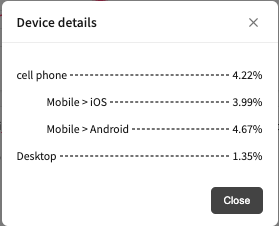
device details
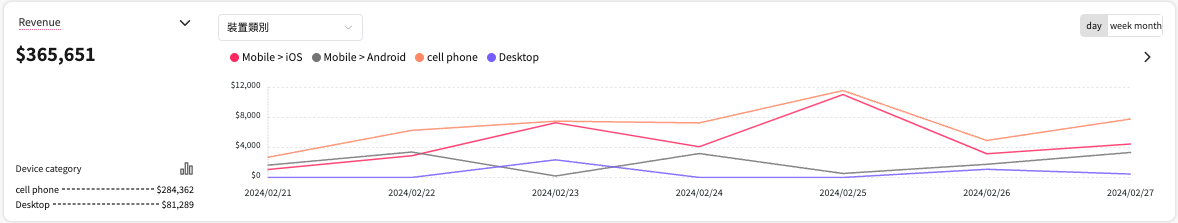
data trends by devices
🧭 Search Query Performance
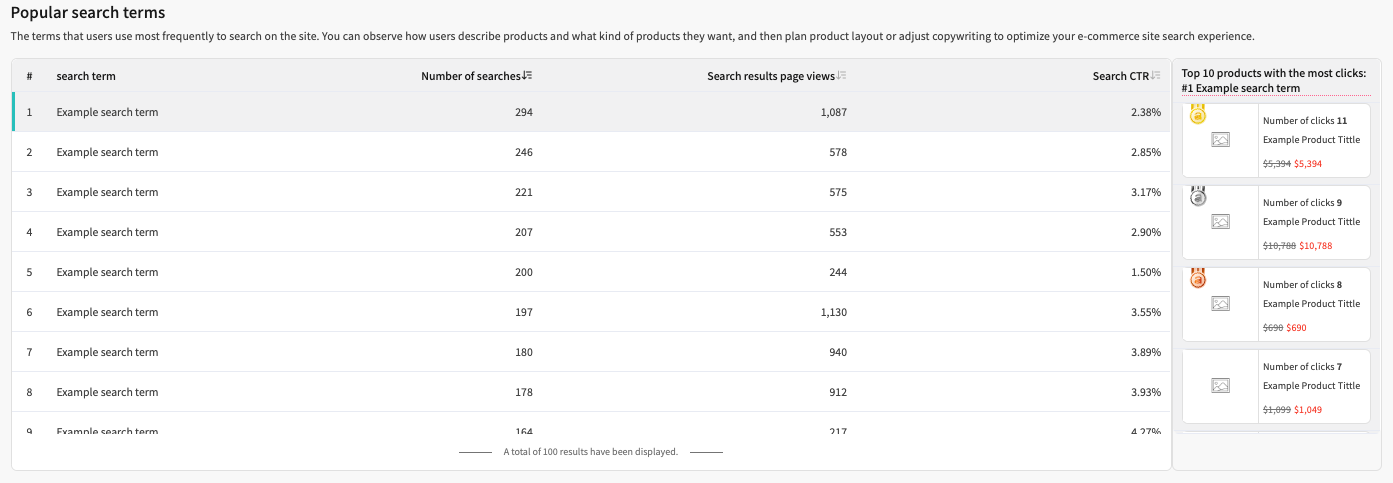
performance panel of the search query
The keywords submitted by your visitors for searches within the site (including system searches submitted after clicking on suggested search content). By observing how users describe their needs and what kind of products they are looking for, you can tailor product selection or refine product copywriting accordingly.
- Search Term: Terms that have been queried.
- Searches: The number of search submissions. This includes the number of times a search is automatically submitted by the system after clicking on AMP-suggested search content.
- Search Result Page Views: The number of times the search results page is viewed. Entering the same URL from different source pages or simply refreshing with F5 is considered separate page views. Repeated views of the same search results pages will be cumulatively counted.
- Search Click Rate: The ratio of searches using the specific term that is followed by any result product clicks on the search results page in the same session. This metric indicates the proportion of searches whose results successfully match the intent, leading to result clicks (product clicks). If more than one product click occurs after the same search, the numerator's click count will not accumulate; it counts as only 1 click at most, so the click-through rate is still 100%.
Identify clicked products on every search-result-pageBy clicking on the row where each search term is located on the right side, you will see the products clicked under each search term. It will display the product image, product title, original price, special price, and the number of times it was clicked on this search results Page.
Edited by: Chi Sun
Updated about 1 year ago