
Product Recommendation Performance
awoo AMP analytics on the performance of the product recommendation.
✨ Preface
If awoo product recommendations appear on your web pages, here is an overview of the performance of your product recommendation program. It enables you to comprehend the financial impact of product recommendations across your website over various periods and to compare outcomes based on page type and marketing campaigns.
Currently, this report summarizes the performance of product recommendations on the homepage, product pages, shopping cart pages, and POPUP product recommendations. Please notice that the breakdown report by different touchpoints is not yet available.
👀 Metric Overview
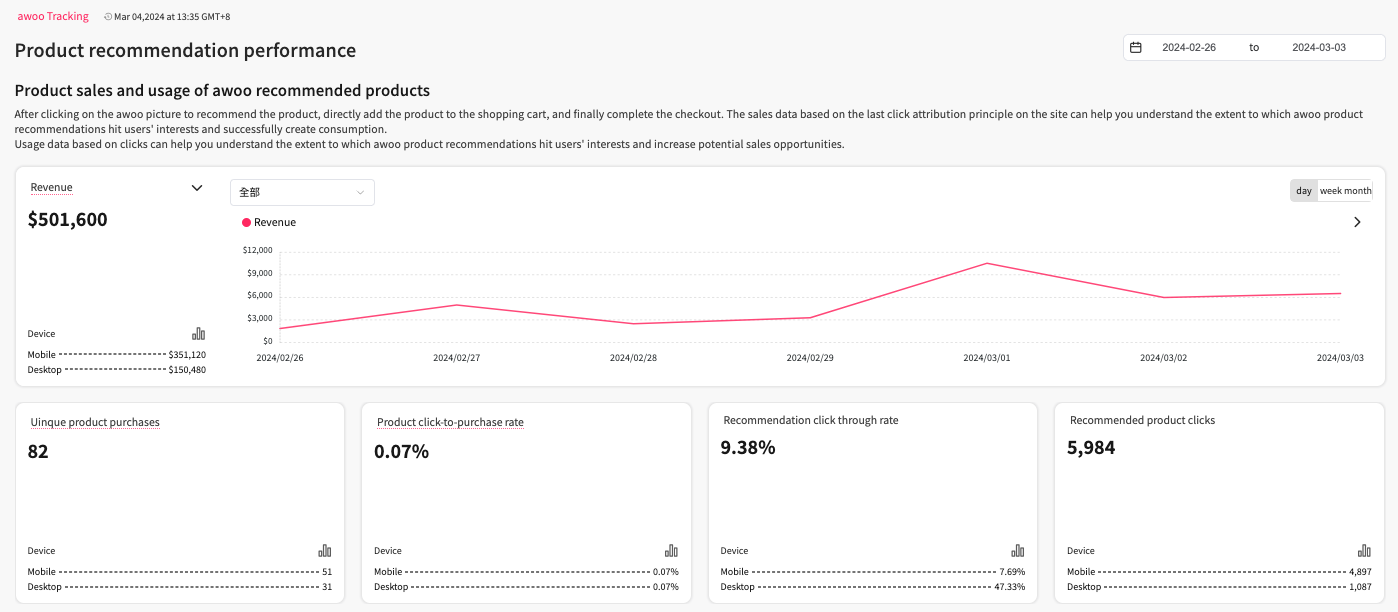
performance panel of the product recommendation
1️⃣ Product Revenue
The product revenue value is obtained by multiplying the sale price by the number of products that were added to the shopping cart and purchased right after clicking the same item from the awoo product recommendation in a single session. The main card presents this data by default, positioned prominently at the top of the section, enabling users to observe data trends over time.
2️⃣ Unique Product Purchases
The number of times a product is added to the shopping cart and purchased right after clicking the same item from awoo product recommendation in a single session. If a transaction involves the purchase of 1 white shirt, 2 red shirts, and 3 pairs of socks, the order counts as 3 unique product purchases (3 unique PID purchases).
3️⃣ Product Click-to-Purchase Rate
The click-to-purchase rate is calculated as follows: (The number of times a product is added to the shopping cart and purchased right after clicking that same item from awoo product recommendation in a single session) ÷ (The number of times any awoo recommended product is clicked within the past 24 hours).
This metric indicates the probability of product clicks from awoo product recommendations leading to a successful product purchase. The reason for looking back "past 24 hours" for the denominator is to align with the "maximum single session length of 24 hours" for the numerator, maintaining the same time window.
4️⃣ Product Recommendation Clicks
The number of times a recommended product is clicked. Repeated clicks on the same product will be cumulatively counted.
5️⃣ Product Recommendation Click Rate
In the same page view, the click rate of the product recommendation is calculated as follows: (the number of times an AMP recommended product was clicked) ÷ (the number of times an AMP product recommendation list was viewed).
Entering the same URL from different source pages or simply refreshing with F5 is considered separate page views. If a recommended product is clicked more than twice during the same impression, the numerator's click count will not accumulate; it counts as only 1 click at most, so the click-through rate is still 100%.
📐 View Metrics on the Line Chart
When you click the dropdown arrow next to the metric name of the top main card, you can change the card content to other metrics. Choose the metric you want to see in the dropdown, and the system will allow you to view the changes in that data over a specific period in the main card. You can also hover over a card without a line chart, and drag it to change the order of these small cards.
After changing the order, a prompt to save this setting will appear at the bottom of the screen. Click confirm, and the next time you return to this page, it will be arranged according to your settings.
📱 View Metrics across Different Devices
The data for both mobile and desktop devices is displayed by default under each card. By clicking the icon next to "device category," a modal will pop up showing the breakdown of data each device type accounts for. The Mobile section will display data for both iOS and Android separately. Moreover, in cards that primarily show line charts, you can select from a dropdown menu to view the data trends for different devices separately.
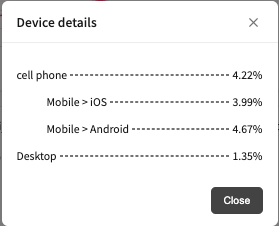
device details
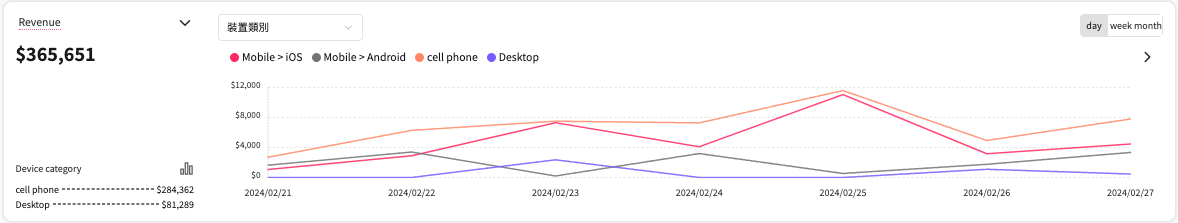
date trends by devices
🧭 Performance Metrics of Each Item
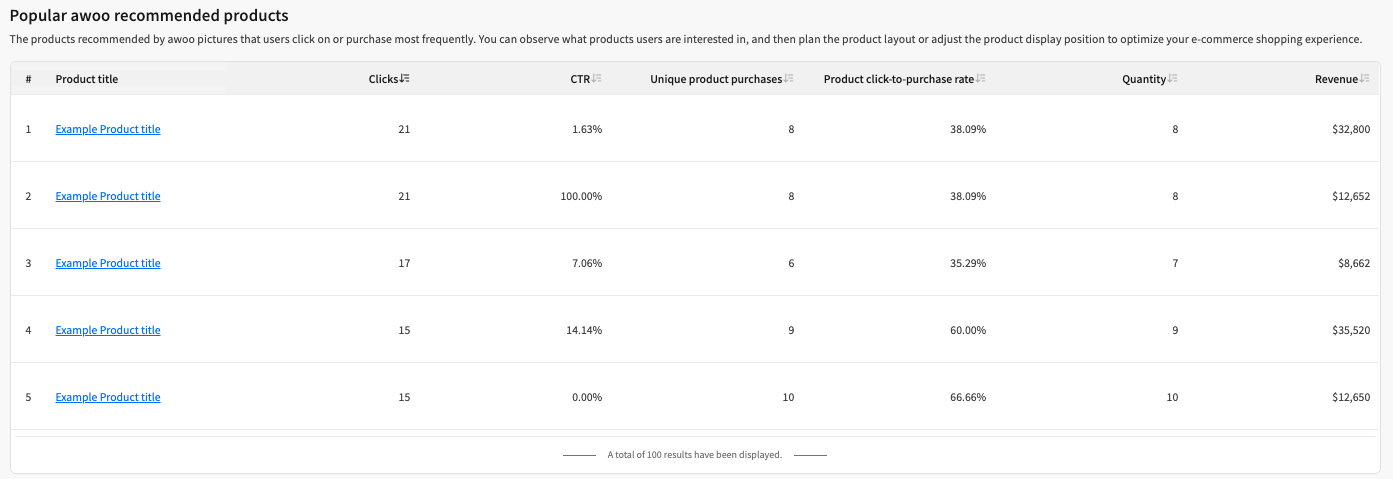
performance panel of the product recommendation
This report displays the "recommended products" that visitors have previously clicked on within the site and their related performance. By hovering the cursor over the product title, you can preview the product image.
- Product Title: Products that have been clicked, link to the corresponding storefront product page.
- Clicks: The number of times the recommended product is clicked.
- Click Rate (CTR): The click-through rate of the recommended product.
- Unique Product Purchases: The number of times the specific recommended product is added to the shopping cart and purchased right after clicking the same item from the awoo product recommendation in a single session.
- Product Click-to-Purchase Rate: It's calculated as follows:
(The number of times the specific recommended product is added to the shopping cart and purchased right after clicking that same item from awoo recommendation in a single session)÷(The number of times the specific recommended product is clicked). - Items Sold: The quantity of the specific recommended product that was added to the shopping cart and purchased right after clicking the same item from the awoo product recommendation in a single session.
- Product Revenue: The product revenue value is obtained by multiplying the sale price by the quantity of the specific recommended product that was added to the shopping cart and purchased right after clicking the same item from the awoo product recommendation in a single session.
Edited by: Chi Sun
Updated about 1 year ago